

The Swarm4Anom project concentrates on investigation of ionospheric anomalies. The study distinguishes two separate areas of interest:
• Ionospheric modelling and data analysis of large-scale and long-term anomalies in the ionospheric structure (More info...)
• Investigation of links between small scale magnetic field fluctuations and powerfull lightning events
Successful cases are stored in the CDF format. Data can be accessed from the repository.
CDF filesCollection of QuickLook files depicting all types of registered fluctuations can be accessed here
QuickLooksThe TIEGCM output NetCDF files for various configurations of the magnetic field.
netCDF files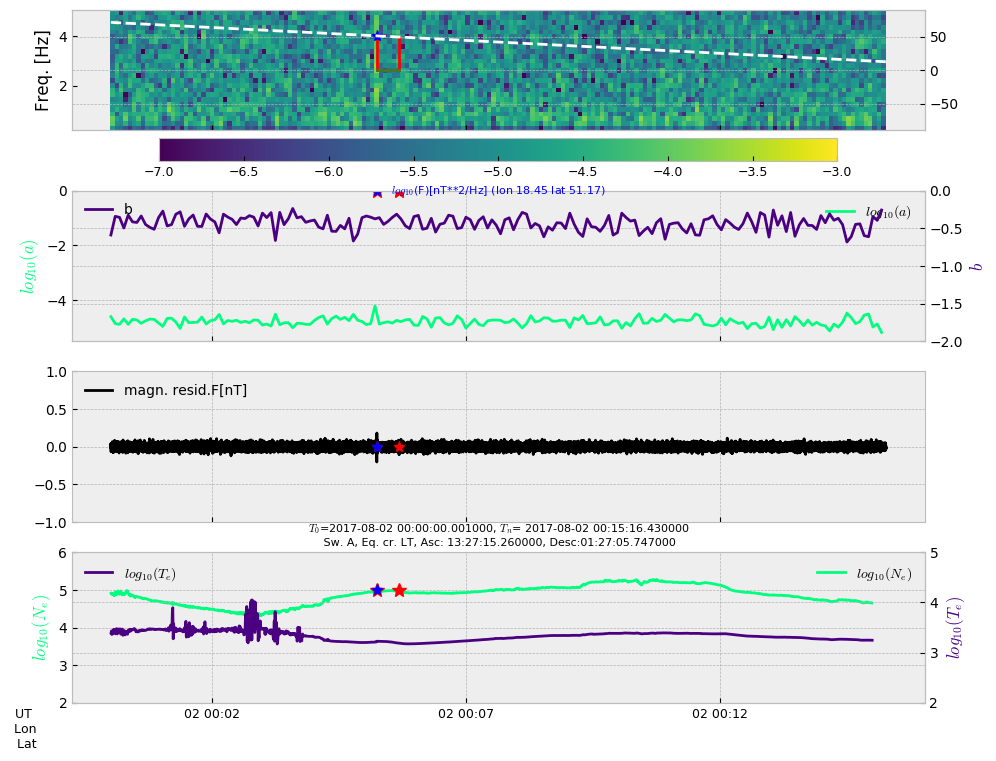
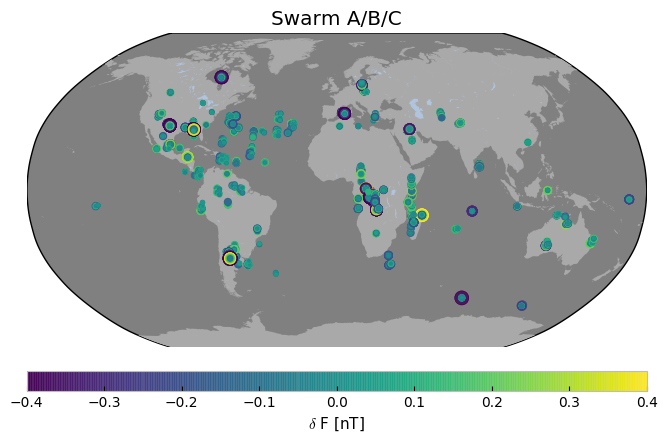
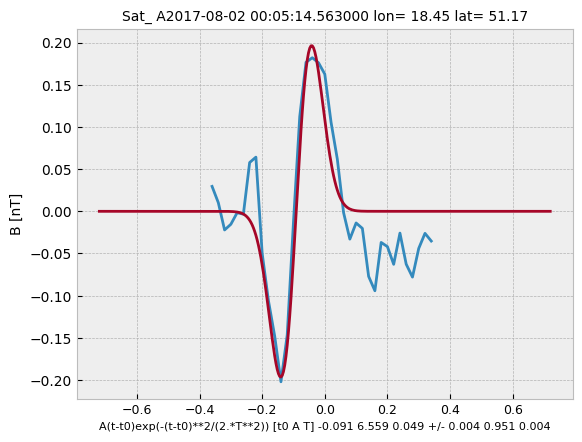
The lightning-dedicated part of the project focuses on a causal relationship between lightning events and certain types of waveforms measured by the vector magnetometer onboard the Swarm satellites. This is the first direct experimental confirmation of a link between lightning and magnetic field fluctuations in the upper ionosphere in the ULF range. During the project a large number of cases was identified showing spatiotemporal correlation between lightning events and magnetic fluctuations measured by Swarm in the upper ionosphere.
The NCAR TIEGCM model was used to examine changes in the spatial pattern of the WSA-like anomalies, which could be linked to long-term changes in the geomagnetic field. A series of simulations provides theoretical analysis of changes in the morphology of the WSA on time scales longer than several decades. Description of results is provided in the paper.
Numerical analysis shows that from the time when the WSA was discovered (around 1960) till present, maximum of the WSA has migrated by 7 degree in longitude towards the Pacific Ocean, showing clear westward drift, consistent with temporal evolution of the geomagnetic dipole component.
Series of tested scenarios allows to understand a role of the dipole component of the Earth`s magnetic field on the fromation of the WSA anomaly:
• TIEGCM runs with a realistic magnetic field configuration determined by the IGRF model for a set of selected years.
• Simplified magnetic field model reduced to dipole representation, with various configurations reflecting different eccentricity and tilt angle of the magnetic dipole.
As an output of the project we provide output results (NetCDF format) for further use. The structure of the output files is in compliance with standard output from the NCAR TIEGCM model descibed here.
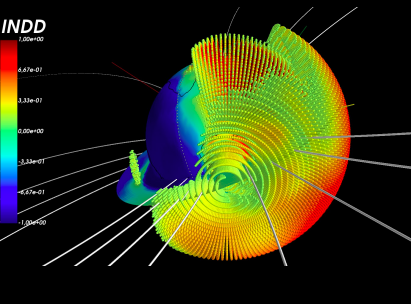 Visualization of grid points for which the index INDD>0.1, illustrating mechanisms related to the WSA phenomenon and similar anomaly in the equatorial region.
(Download zip files with movies...)
Visualization of grid points for which the index INDD>0.1, illustrating mechanisms related to the WSA phenomenon and similar anomaly in the equatorial region.
(Download zip files with movies...)
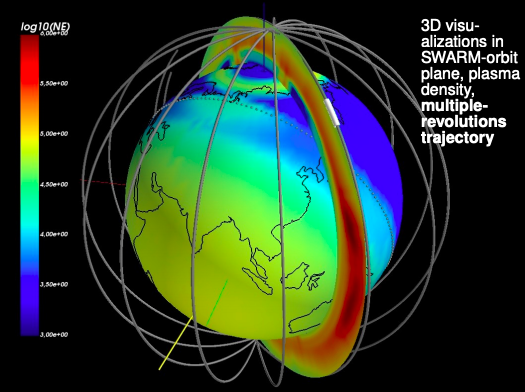 Visualization of the Swarm trajectory overplotted onto the distribution of the electron density.
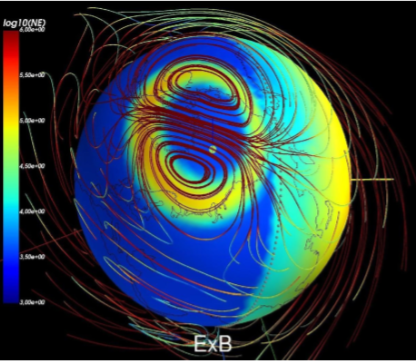 Streamline tracking of simulated neutral wind over-plotted onto the distribution of the electron density. Similar visualizations are available for ExB drift.
The Swarm4Anom project is funded by the European Space Agency under contract: ESA Contract No. 4000112769/14/NL/FF/gp

